How to Use Dashboard
Continuing from our Getting Started guide, you might be wondering how to monitor your AI’s training progress. While printing to the console works for simple examples, real-world projects often require more sophisticated monitoring.
The RLMatrix Dashboard provides real-time visualization of training metrics, helping you determine if your AI is learning effectively, has finished training, or is failing to make progress.
Setting Up the Dashboard
Option 1: Clone the Full Repository
If you want the full RLMatrix source code:
git clone https://github.com/asieradzk/RL_Matrix.gitOption 2: Get Just the Dashboard
If you only need the dashboard component:
git clone --filter=blob:none --sparse https://github.com/asieradzk/RL_Matrix.gitcd RL_Matrixgit sparse-checkout set src/RLMatrix.DashboardRunning the Dashboard
Once you have the dashboard code, you can:
- Open the project in your preferred editor (like Visual Studio or VS Code)
- Build and run the project
Alternatively, you can build the binary and run that directly.
Since this is a Blazor Server application, you’ll see a console window with output similar to:
info: Microsoft.Hosting.Lifetime[14]Now listening on: https://localhost:7126info: Microsoft.Hosting.Lifetime[14]Now listening on: http://localhost:5069info: Microsoft.Hosting.Lifetime[0]Application started. Press Ctrl+C to shut down.info: Microsoft.Hosting.Lifetime[0]Hosting environment: Developmentinfo: Microsoft.Hosting.Lifetime[0]Content root path: D:\path\to\your\dashboard\RLMatrix.DashboardIf a browser window doesn’t open automatically, navigate to https://localhost:7126 in your browser.
Connecting Your Project to the Dashboard
Let’s revisit our pattern matching example from the Getting Started guide. When you run your training code, you should see a message in the console:
Connected to dashboardIf you don’t see this message, something went wrong with the connection. Double-check that:
- The dashboard is running
- Your training code has the correct connection settings
- No firewall is blocking the connection
Interpreting Dashboard Data
After starting your training, refresh the dashboard page. You should now see your experiment name in the top-left dropdown menu. Select it to view your training metrics:
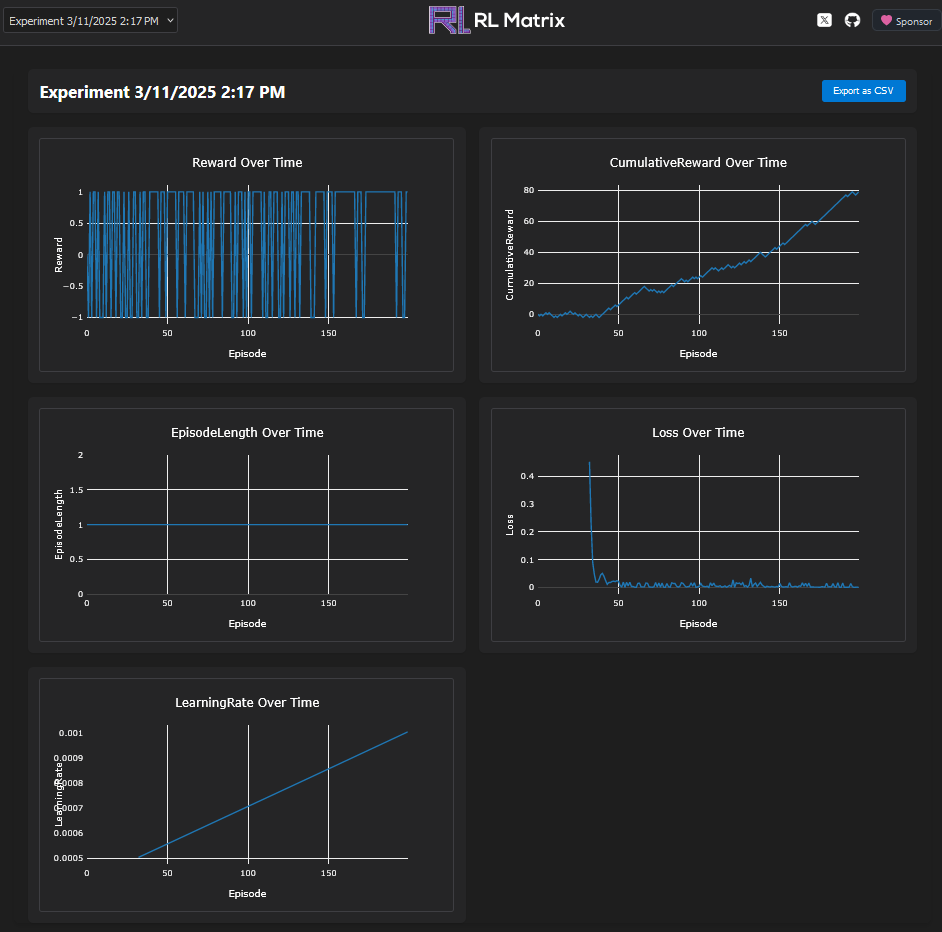
The dashboard displays several important metrics:
Reward Over Time
This graph shows the reward received per episode. For our pattern matching example, you should see it award -1 less frequently as the AI learns the correct pattern.
Cumulative Reward Over Time
This shows the sum of rewards over time. The change of slope of this graph is particularly important - slope becomes steeper as your AI learns to maximize rewards.
Episode Length Over Time
This tracks how many steps each episode takes. In our simple pattern matching example, this will always be 1 since we take one step per episode. In more complex environments (like Cart-Pole), this metric can reveal if your agent is surviving longer over time.
Loss Over Time
This shows the neural network’s loss function value. Look for a generally decreasing trend - this indicates your model is fitting the data better.
Learning Rate Over Time
This displays changes in the neural network’s learning rate. By default, RLMatrix uses a scheduler that causes small oscillations during training.
Real-Time Updates
One of the most powerful features of the dashboard is its real-time updating. As your training progresses, the dashboard will update automatically to reflect the latest metrics.
In our pattern matching example, you can press Enter in your console window to continue training and watch the dashboard update in real-time.
Exporting Training Data
For further analysis or record-keeping, you can export your training data by clicking the “Export as CSV” button in the top-right corner of the dashboard.
This allows you to:
- Perform custom analysis in Excel or other tools
- Compare different training runs
- Share results with colleagues
Next Steps
Now that you understand how to monitor your training with the dashboard, you’re ready to explore more complex environments and action spaces.